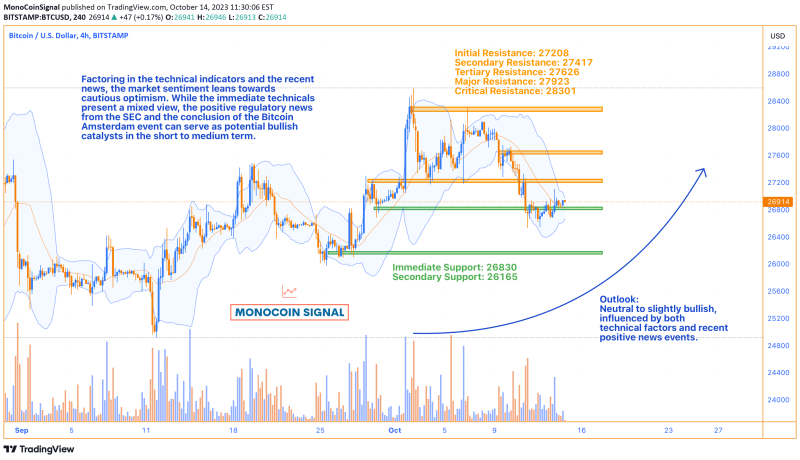
Bitcoin, as represented on the 4H timeframe, displays a blend of bullish and bearish signals, with recent price action showing consolidation and occasional spikes in both directions, hinting at market uncertainty.
Key Analysis Points:
1. The price is hovering above the Ichimoku Cloud, suggesting potential bullish momentum.
2. The MACD’s position below its Signal line, coupled with its negative value, signals bearishness. However, a histogram value of 47 hints this momentum may be waning.
3. The Stochastic Oscillator’s %K (67.32) and %D (60.75) values, being above 50 but below 80, suggest a bullish short-term momentum.
4. The RSI stands at 46.24, slightly bearish as it’s under the 50 threshold.
5. Trading volume doesn’t show significant spikes, indicating a lack of strong trend confirmation.
Recent News Influence:
On October 14, 2023, Bitcoin saw a minor price uptick, likely influenced by the SEC’s decision not to contest a court ruling favoring Grayscale Investments and their Bitcoin ETF plans. This development might usher in a warmer regulatory environment for Bitcoin ETFs.
Additionally, the culmination of the Bitcoin Amsterdam event, a significant conference in Europe, symbolizes the Bitcoin community’s continuous growth and dialogue.
Probable Scenario:
Factoring in the technical indicators and the recent news, the market sentiment leans towards cautious optimism. While the immediate technicals present a mixed view, the positive regulatory news from the SEC and the conclusion of the Bitcoin Amsterdam event can serve as potential bullish catalysts in the short to medium term.
Overall Sentiment: Neutral to slightly bullish, influenced by both technical factors and recent positive news events. Trade active: On the 4H timeframe, Bitcoin’s oscillation displays evident market tension. After briefly probing the 30,000 region, we’ve seen a retraction to the 28,601 mark. The 1D Fibonacci retracement, however, offers crucial insights:
The close proximity to 0 (28592) level hints at minor resistance, reaffirmed by the recent rebound from around 30,000.
0.5 retracement at 26756 stands as a substantial support zone, made evident by Bitcoin’s recent resilience around this point.
Notably, the 0.618 level at 26323, often dubbed the ‘Golden Ratio’, remains a pivotal area to monitor. Should we witness a deeper decline, this could emerge as a fierce contention zone.
The 4H technicals shed more light: The MACD’s bearish demeanor is somewhat tempered by a histogram value of 195, suggesting a possible slackening in downward momentum. The Stochastic Oscillator paints a moderately bullish picture, while the elevated RSI at 83 signals overbought conditions and potential for a pullback.
In summary, the backdrop is one of cautious optimism. The confluence of recent regulatory developments and technical indicators underscores a potentially volatile short-term scenario. The bullish undertone is palpable, especially with the ascent towards 30,000, but the high RSI on the 4H chart warrants vigilance for potential retracement.

