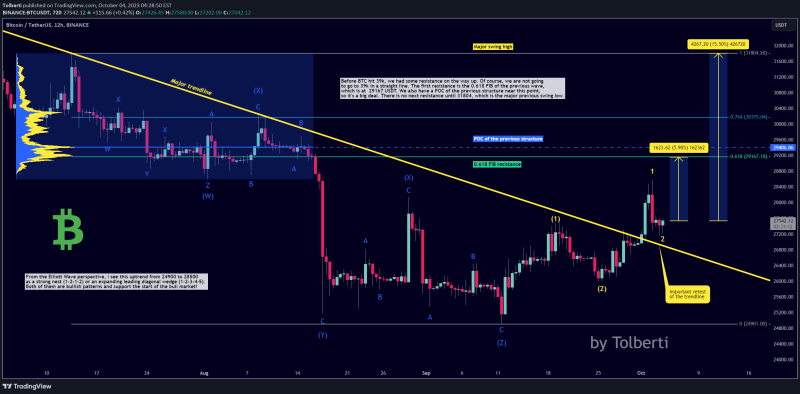
- Bitcoin will hit 39k this year in December 2023, according to my technical analysis and calculations. This new analysis is on the 12h chart and shows very important technical data!
- First, we need to consider the major yellow descending trendline. This trendline has been destroyed by the bulls, and we also had a successful retest of it! This is your chance to buy / long BTC at the current low price. Thank me later!
- Before BTC hit 39k, we had some resistance on the way up. Of course, we are not going to go to 39k in a straight line. The first resistance is the 0.618 FIB of the previous wave, which is at 29167 USDT. We also have a POC of the previous structure near this point, so it’s a big deal. There is no next resistance until 31804, which is the major previous swing low.
- I don’t know how about you, but I am prepared for the bull market that is coming in the next few weeks until January! Expect January to be a bearish month.
- From the Elliott Wave perspective, I see this uptrend from 24900 to 28500 as a strong nest (1-2-1-2) or an expanding leading diagonal wedge (1-2-3-4-5). Both of them are bullish patterns and support the start of the bull market!
- Let me know in the comment section (right now) what you think about BTC and have you bought it.
- Thank you, and for more ideas, hit “Like” and “Follow”!
- This analysis is not a trade setup; there is no stop-loss, entry point, profit target, expected duration of the trade, risk-to-reward ratio, or timing. I share my trades transparently and privately.

