These four analysts employed different means to predict the market volatility but arrived at a similarly accurate result.
Elliott Wave Count Correctly Predicts End of Correction
Elliott Wave theory involves the analysis of recurring long-term price patterns and investor psychology to determine the direction of a trend. The trading method accurately predicted the local bottom and ensuing bullish trend reversal in June.
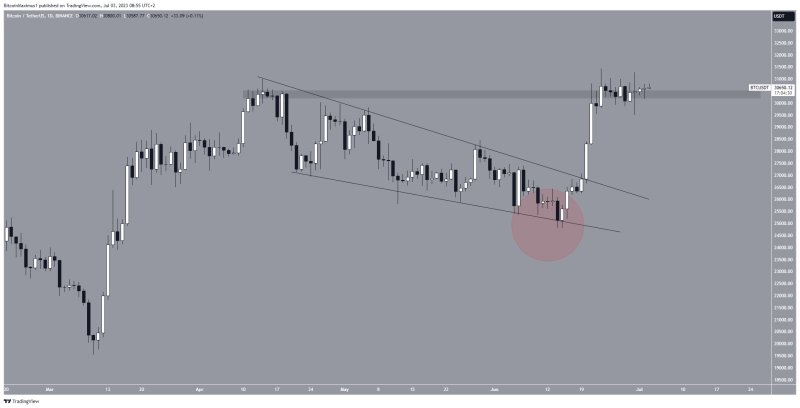
In the middle of June, Elliott Wave specialist @TheTradingHubb tweeted that the BTC price had completed a diagonal, as evidenced by its wedge shape. While he did not give a target for the top of the movement, he suggested that a breakout from the pattern would transpire.
Similarly, @XForceGlobal used a descending wedge and a corrective pattern to predict the BTC bottom at $36,000 correctly.

BTC/USDT Daily Chart. Source: TradingView
Both BTC price predictions suggested that a high near $30,000 could be reached, and that was not the case. However, the predictions were amended once the price got closer to $30,000 due to the sharpness of the movement.
In any case, the price action and EW theory were correctly used to perfectly identify the $24,800 bottom (red circle) and catch an increase to $30,000, which is quite profitable in its own right.
Read More: Best Crypto Sign-Up Bonuses in 2023
Retest of Resistance Leads to Bounce
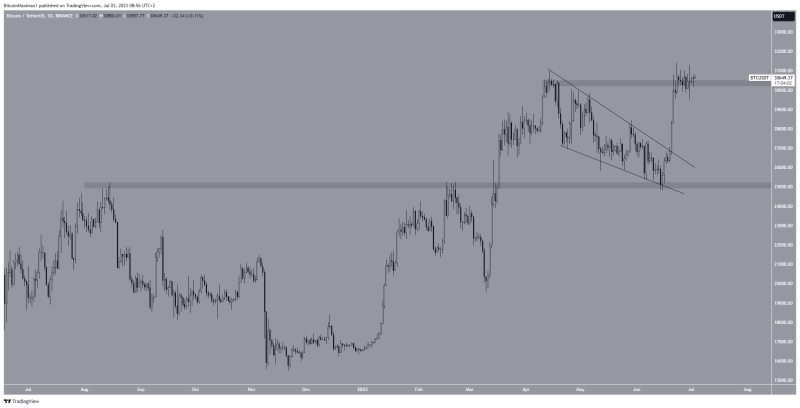
Cryptocurrency trader IncomeSharks tweeted a simple retest of the previous resistance area at $25,000. He stated that it is likely that the retest will lead to a significant upward movement, as was the case.

BTC/USDT Daily Chart. Source: TradingView
Since the tweets, the BTC price has bounced at the $25,000 level, reclaimed the $26,700 area, and is now trying to reclaim the $30,400 resistance area. If successful, the upward movement could accelerate to $35,000.
However, if the BTC price gets rejected at the current resistance, a drop to $25,000 will be on the cards.
Read More: Top 9 Telegram Channels for Crypto Signals in 2023

