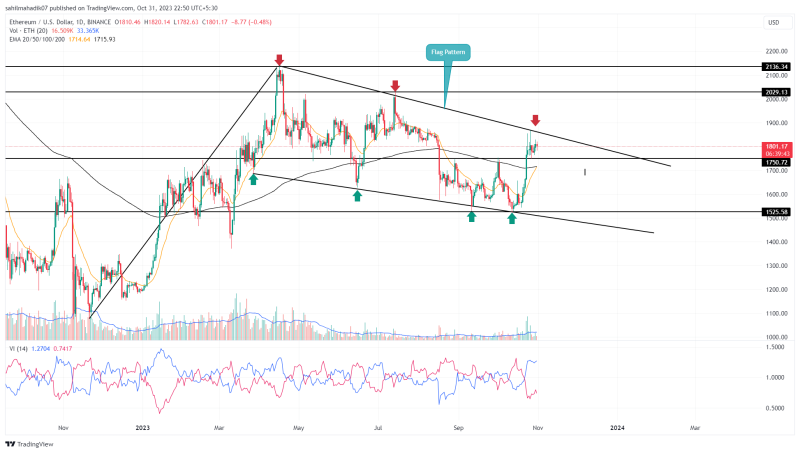
Over the past two weeks, the Ethereum Price has exhibited a remarkable recovery on its daily chart, surging 17.8% from its local support at $15.25 to currently trade at $1798. However, this rally appears to be hitting a resistance wall around the $1,850 level, mirroring the supply pressure faced by the leading cryptocurrency Bitcoin. This heightened supply pressure evidenced by the long-wick rejection candles casts doubt on the durability of the ongoing recovery.
Also Read: Solana Vs Ethereum: A Deep-Dive Analysis of Two Popular Coins
Dual Resistance Threatens for New Correction
- The flag pattern governs the current correction trend in the Ethereum coin.
- A bullish breakout from the overhead trendline could set a rally beyond $2000
- The intraday trading volume in Ether is $6.7 Billion, indicating a 5.9% loss.
Source- Tradingview
The Ethereum price recovery faces a formidable hurdle at the $1,850 level, coinciding with the upper trendline of a bullish flag pattern. Amid the prevailing uncertainty emanating from the Bitcoin price consolidation, the ETH price too has been trading sideways for over a week.
Although sellers have attempted to exploit this market flux, the buyers have been steadfast in maintaining a floor at $1,750. Consequently, the coin price oscillates between this support level and the overhead trendline.
A decisive breakout or breakdown from this range will offer a clearer outlook for near-term price action. Should the market supply pressure intensify, a drop below the $1,750 level could instigate a significant correction, maintaining the asset within its current flag pattern.
In such a scenario, the Ethereum coin could potentially slide toward its lower trendline, currently situated below the $1,500 mark.

1 ETH to USD = $1813.751 0.72% (24h) Buy / Sell


Buy Crypto on an easy to use platform
Invest in leading cryptocurrencies such as Bitcoin, Ethereum, Cardano and more…

ETH

USD
Is Ethereum Price Heading to $3000?
While the current market sentiments remain uncertain, the ETH price is strictly following the flag pattern formation, evidenced by the multiple rebounds within its trendline. In theory, this pattern is a bullish continuation pattern, and therefore it should bolster buyers to break above the overhead trend line. A potential breakout with a daily candle closing would accelerate the buying momentum and could surge the altcoin to a potential target of $2,292 followed by a $3,000 mark
- Vortex Indicator: The considerable gap between the VI+ and VI- slopes in a bullish crossover state confirms the recovery trend remains robust.
- Exponential Moving Average: An impending bullish crossover between the 20-day and 200-day EMA slopes could further intensify buying interest in this asset.


