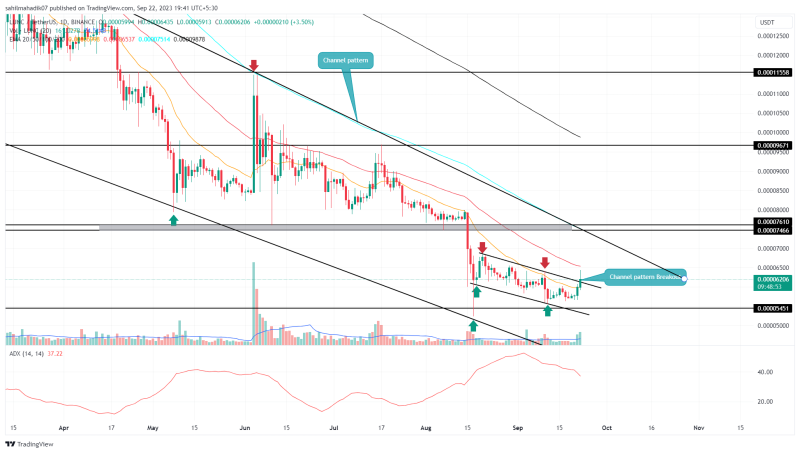
Defying the broader market supply pressure in the crypto market, the Terra Classic coin price continues on a recovery path. The coin price rising for four consecutive days has recorded a 15% gain and pierced the upper resistance of the channel pattern. This breakout offers buyers significant support to trigger a sustained recovery.
Also Read: Terra Luna Classic (LUNC) Proposal For USTC Burn By Binance Officially Passed
Bullish Recovery Targets $0.000075 Barrier
- A bullish breakout from the overhead trendline sets the altcoin for a 20% Jump
- Crypto holders may witness high supply pressure around the $0.000075 mark.
- The intraday trading volume in the LUNC coin is $55.2 Million, indicating a 14% gain.

Source- Tradingview
With a noteworthy intraday gain of 4% coupled with a significant uptick in trading volume, the LUNC price has successfully breached the channel pattern’s resistance trendline. This channel pattern had shackled this altcoin in a bearish grip for the past month and, therefore, this breakout signals a possible change in market sentiment and hints at a forthcoming bullish phase for the asset.
As of this moment, the LUNC price is trading at $0.0000625. If the coin manages to maintain its position above the recently surpassed trendline, we might see an upward thrust, potentially reaching the $0.000075 level, marking a 20% gain.
Is LUNC Price Ready For A Bullish Trend?
While the immediate future for the Terra Classic coin looks promising, it’s essential to take a broader view. A glance at longer time frames suggests that coin price is navigating within an expansive channel pattern, mirroring its current trajectory but on a larger scale. Consequently, the anticipated rally to $0.000075 also aligned with the resistance of this overarching channel. If that’s the case, the LUNC price might encounter significant selling pressure, possibly redirecting its path back into bearish territory.
- Exponential Moving Average: The coin price breakout above the 20-day EMA slope offers buyers an additional edge to hold
- Average Directional Index: A downtick in the daily ADX slope reflects the weakening of prior bearish momentum.

