The price has cleared multiple resistance levels and is approaching its all-time high. But can it reach it?
Injective Breaks Out From Long-Term Resistance
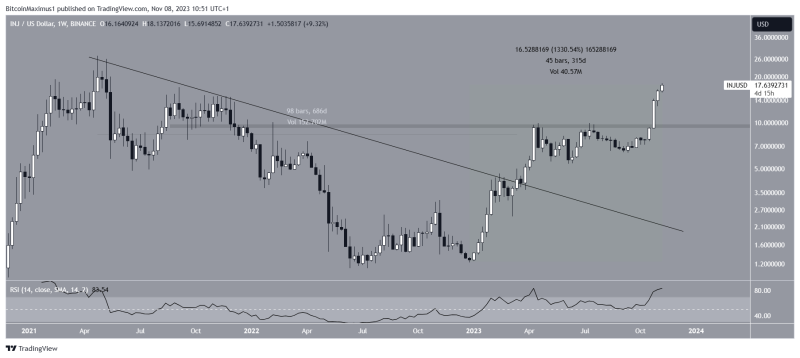
The Injective price has increased swiftly since the beginning of the year. In a little over 300 days, the price has moved upward by 1,330%.
In March, INJ broke out from a descending resistance trend line that had been in place for nearly 700 days.
After a length setback with the $9.50 resistance area, INJ broke out in October and has increased rapidly since.
When evaluating market conditions, traders use the Relative Strength Index (RSI) as a momentum indicator to determine whether a market is overbought or oversold and whether to accumulate or sell an asset.
As a result, if the RSI reading is above 50 and the trend is upward, bulls still have an advantage, but if the reading is below 50, the opposite is true.
The weekly RSI is above 50 and moving upwards, both considered positive signs.

INJ/USD weekly chart. Source: TradingView
INJ Price Prediction – Is All-Time High Within Reach?
The Elliott Wave theory, which involves studying recurring long-term price patterns and investor sentiment, supports continued price growth.
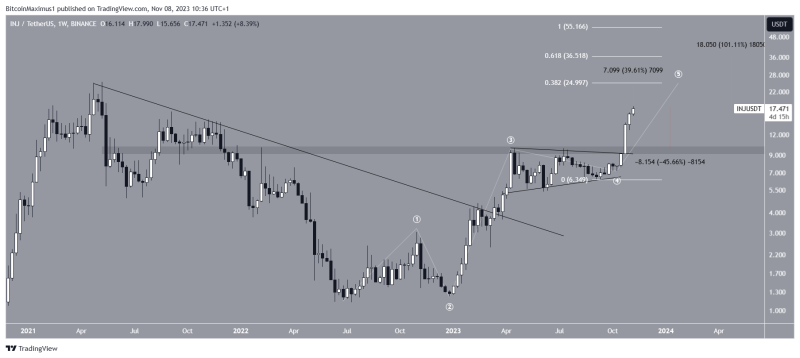
According to this theory, the altcoin is in the fifth and final wave of its upward movement.
Then, by measuring the lengths of the first and third waves, we can estimate the potential length of the fifth wave using Fibonacci projections.
The Fibonacci retracement levels theory suggests that after a significant price move in one direction, the price is expected to partially retrace to a previous price level before continuing in the same direction.
This theory can identify potential future peak levels for price increases.
Applying this theory, if wave five has 0.382 of the combined length between waves one and three, it could push INJ’s price to $25, just slightly below its all-time high of $25.30.
This would represent a 40% increase from the current price. If wave five extends further, the altcoin’s price could increase by 100% and reach the next resistance level at $36.50.

INJ/USDT weekly chart. Source: TradingView
Finally, it’s important to note that despite this optimistic INJ price prediction, if the price reaches a local peak, it could decline by 45% and return to the horizontal support area at $9.20.
How to Use TradingView. Source: BeinCrypto

